This post originally appeared on Amino.Every time you go to the doctor, your diagnosis is recorded as a medical code. They’re notoriously complicated—more than 3,000 ICD codes are used just to describe physical injuries. There’s a five digit number for everything from "insect bite" to "animal-drawn vehicle accident."In the past year, nearly 1 out of every 6 patients in Amino's database were diagnosed with a physical injury, so we thought it would be interesting to take a closer look.We grouped these injury codes and gave them common names (like "bruising" instead of 38 different kinds of "contusion"). Then, we looked at every injury diagnosis in our health insurance claims database from 2012 to 2016. (You can read more about our methodology below.)
The most common injuries in America
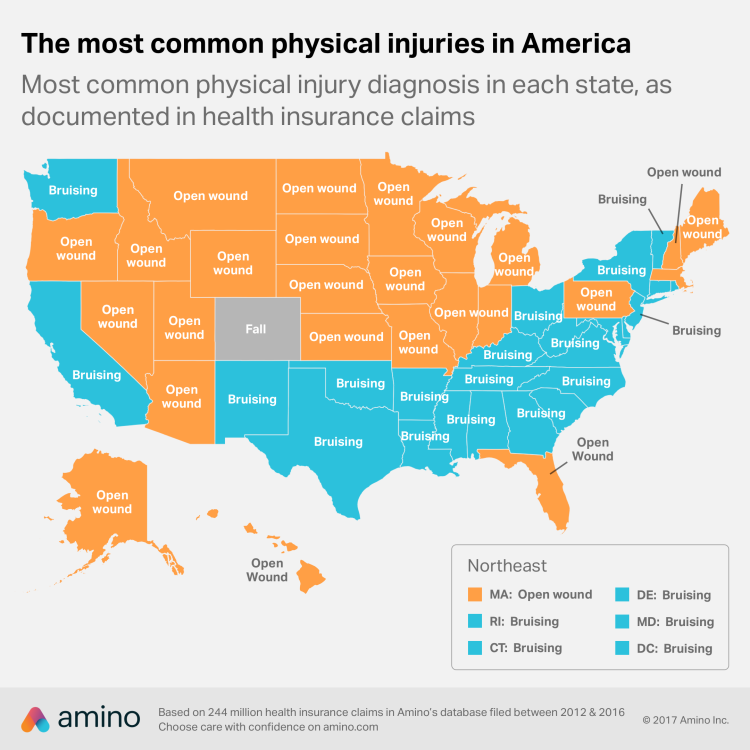
Due to the sheer number of categories, no single injury accounts for more than 7-8% of all diagnoses related to physical injuries. Still, we found that the most common injuries don’t vary a lot across the country."Bruising" or "open wound" are the most frequent injury diagnoses in every state except Colorado, where "fall" tops the list. (If you’re curious, "open wound" applies to injuries where the skin is broken. Most are minor cuts.)

Interesting, but not surprising. Cuts and bruises are everyday injuries that most people endure, regardless of geographic location.We wanted to know: what makes each state distinctive?
The most distinctive injury in each state
To figure this out, we compared each injury’s frequency per state with the national frequency. That allowed us to determine which injuries were disproportionately more or less common in each state, compared to the nation as whole.Here’s an example. Injuries related to motor vehicle accidents make up 1.5% of all physical injury diagnoses in the United States. But in Tennessee, they make up 2.5%—that’s 1.6 times more common than the national distribution.You can read more about our methodology below. But first, here’s what we found:

Remember: these are not the most common injuries in each state—that’s bruising or open wounds nearly everywhere—but rather, injuries that are disproportionately frequent.Some broad trends stand out, including the prevalence of "suffocation" (a broad category related to oxygen deficiency) in six of the eight Mountain states: Nevada, Idaho, Utah, Wyoming, Colorado, and New Mexico. Diagnoses related to "suffocation" were 1.8 times more common in Idaho compared to the national distribution, and 3.1 times more common in Utah. The other four states fell somewhere in the middle.We can’t say for sure why this is. But the vast majority of "suffocation" diagnoses were for hypoxemia, the medical term for low blood oxygen. Interestingly, hypoxemia can be caused by exertion at high altitudes, where oxygen is scarce. We can’t prove that this is correlated to the altitude of Mountain states, but it could be related.Other results seem to corroborate documented issues, like the disproportionate number of concussions in Massachusetts. According to a 2016 report from Blue Cross Blue Shield, concussions diagnoses have been rising across the country due to increased awareness—and Massachusetts had the highest youth concussion rate in the country in 2015.For a full list of the most distinctive injury in each state, see below.
The wild west of medical codes
For the purpose of this analysis, we focused on injuries that affected at least 1% of physical injury diagnoses in each state. That way, we saw injuries that were distinct, but not extreme outliers.If you loosen that standard to 0.1% (thus including extremely uncommon injuries), some notable differences emerge:
"Near-drowning" diagnoses are 6.2 times more common in Hawaii than they are nationally. This makes sense for the only state completely surrounded by water, and it seems to be in line with the state’s data.
"Animal-drawn vehicle accident" diagnoses (which include riding an animal) are disproportionately common in five states: Idaho, Montana, Wyoming, North Dakota, and Nebraska. Surprisingly, there were nearly 43,000 "animal-drawn vehicle accidents" in our national data from 2012 to 2016. More than 1,000 occurred in Nebraska alone.
"Unarmed fight or brawl" is disproportionately common in New York. There were 295,797 "unarmed fight or brawls" diagnoses in our national data, and 35,000 occurred in New York. That means New York accounts for more than 10% of medically documented fist fights in America.
These injuries affect a relatively small number of Americans each year—but they’re common enough for a code to exist.
List of distinctive injuries by state
Based on 244 million health insurance claims in Amino’s database filed between 2012 and 2016
Methodology
There are over 3,000 ICD-9 codes related to physical injuries (broken bones, sprains, scrapes, cuts, bruises, etc.). We grouped these codes into about 170 sets and gave them common names. (Where applicable, we mapped ICD-10 codes to ICD-9 codes to keep our groupings consistent.)First, we looked at every diagnosis in our health insurance claims database between 2012 and 2016 that included these code sets. The resulting data set includes 244,000,000 claims. Then, we computed the distribution of these cases nationally and in each state. Finally, we compared the state distributions with the national distributions to determine which injuries were disproportionately more or less common in each state, compared to the nation as whole.Keep in mind: we’re looking at health insurance claims as documented by the doctors involved in these cases. The degree of detail to which each claim is coded, and coding practices in general, vary quite a lot from practice to practice. In fact, it may very well be that doctors in some states code injuries differently than other states. Due to inconsistent coding practices, this data also reflects how doctors and insurance companies keep track of their records.Furthermore, many of these code sets get coded together in the same claim, further reinforcing the idea that we’re observing coding behavior. For example, you could see codes for a broken rib, broken wrist, and motor vehicle accident all in one claim.Analysis and data visualizations by Sohan Murthy